
👋 Hi, I’m Andre and welcome to my newsletter Data Driven VC which is all about becoming a better investor with Data & AI. Join 34,300 thought leaders from VCs like a16z, Accel, Index, Sequoia, and more to understand how startup investing becomes more data-driven, why it matters, and what it means for you.
ICYMI, check out our most read episodes:
Welcome to another edition of our Sunday “Resources” stream where we share our most valuable data & resources across four rotating formats:
Hottest Startups of the Month (last episode with Top 30 in June here)
Top Downloaded Resources from The Lab #1 (last one here with 312 Family Offices that actively invest in Funds & Startups)
State of the Market (this is today!)
Top Downloaded Resources from The Lab #2 (last one here with top 10 prompts for deal winning & closing)
For 1. and 3., we collaborate with best-in-class partners to ensure you get the highest quality data.
For 2. and 4., we leverage our ever-growing product portfolio and share selective snapshots of the most sought-after resources from The Lab.
State of the Market - June 2025

Most data for today’s episode was provided by our partner Multiples.vc, your go-to source for verified M&A valuation multiples and public comps based on analyst estimates, at a fraction of the price of legacy data providers.
We aim to unify market & valuation data into a single episode, so you don’t need to check various sources for a complete picture. Here’s what we’ll cover today:
#1 Markets
Top 10 private market companies + spotlight Anthropic & OpenAI
State of IPOs: Top 50 candidates & sentiment
State of M&A: Number of transactions, deal volume + spotlight Meta x Scale AI
#2 Multiples
Top 10 vs Top 50 EV/NTM Revenue
EV/NTM Revenue over time and by sector
Efficiency Benchmarks incl. revenue per FTE, Rule of 40 & more
We have a lot on the agenda, so let’s jump in👇
1. Markets
Top 10 Private Market Companies
Let’s start with a snapshot of the top 10 most valuable private market companies. Compared to last month, we find Anthropic rejoining with their recent $3.5bn Series E at $61.5bn post-money.

Source: Position.so
Spotlight: Anthropic + OpenAI
As Reuters reported earlier this month, Anthropic has just crossed $3bn revenue run rate. This represents a big jump from December 2024 when the metric was nearly $1bn, and end of March 2025 when it was at $2bn. At $61.5bn post-money and $3bn revenue run rate, the company is valued at an almost conservative 20x multiple.
For comparison, Anthropic competitor OpenAI has just crossed $10bn revenue run rate, up from $5.5bn in December 2024, according to Reuters. At their April 2025 valuation of $300bn, this represents a 30x multiple, reflecting a doubling within 6 months at such massive absolute base.
Top 50 IPO Candidates
As private companies keep pushing the boundaries on their commercial trajectories, let’s look at the top 50 IPO candidates for 2025 & 2026. Here’s the snapshot from last month.
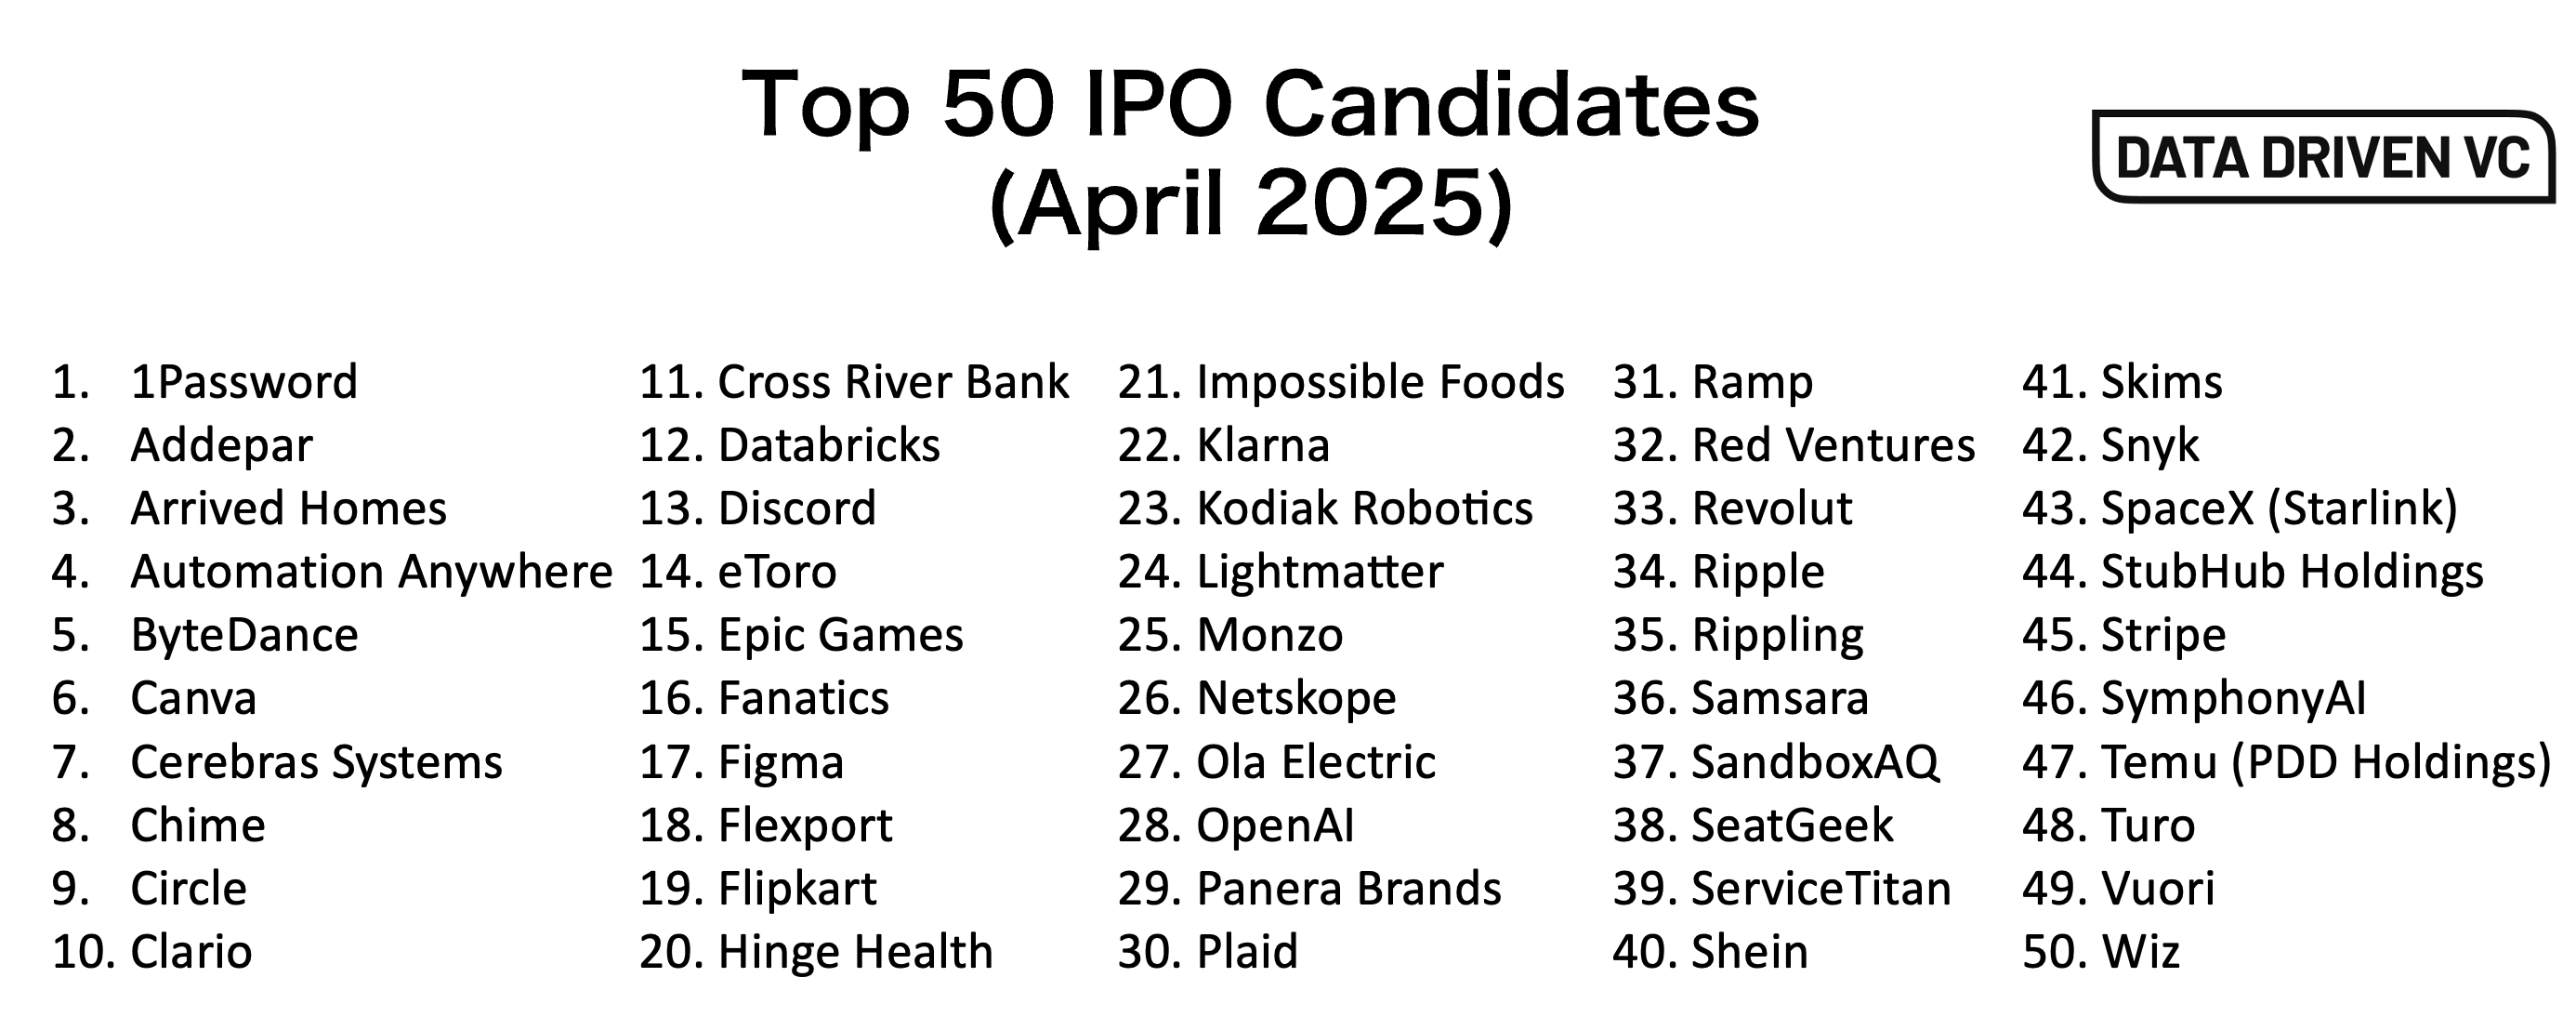
Since then, 3 of the top 50 candidates successfully completed their IPO:
Hinge Health, 21 May 2025 at HNGE, up 13% since listing
Circle, 5 June 2025 at CRCL, up 700%+ since listing
Chime, 12 June 2025 at CHYM, down 33% since listing
Overall some promising developments, despite macro uncertainty and extreme volatility in the markets. Key investors in these companies include Atomico, Coatue, DST, ICONIQ, Insight, Tiger, finally returning some liquidity to private market investors.
State of M&A
Talking about liquidity, let’s close this section with a quick look at M&A activity.

Source: Multiples.vc
We only include M&A transactions with confirmed EVs available at Multiples.vc, thus structurally exclude the long tail noise of smaller EV transactions. With 1477 (vs 1186 in May) disclosed transactions YTD, we’re still behind the same period in 2024, continuing to be the lowest in over a decade.
While we’re at 40% in number of transactions relative to the FY2024, the deal volume is at $1.4T and 54% relative to FY2024 - a clear indication towards fewer but significantly bigger transactions as confirmed by the increase in average deal size close to $1B.

Source: Multiples.vc
A New Breed of M&A: Minority Investments and Acquihires
Although formally not an acquisition, the lighthouse deal in the last 30 days was the 49% minority investment by Meta in Scale AI - that informally equates an acquihire as Scale’s founder, Alexandr Wang, is joining Meta to work on Meta’s AI efforts.
Amid increasing global antitrust scrutiny, major tech firms are shifting from traditional acquisitions to minority investments as a strategic workaround. These investments—typically below regulatory thresholds—allow companies to gain access to innovation, influence product direction, and establish preferred relationships with startups without triggering formal merger reviews. Oftentimes, an acquihire and transition of key talents is the consequence.