💥Benchmarking Bonus Packages, Exploding CAC Payback for SaaS, Impact of Pricing on Sales Motions & More
Digesting Insights From the Data
👋 Hi, I’m Andre and welcome to my newsletter Data Driven VC which is all about becoming a better investor with Data & AI. Join 34,520 thought leaders from VCs like a16z, Accel, Index, Sequoia, and more to understand how startup investing becomes more data-driven, why it matters, and what it means for you.
ICYMI, check out our most read episodes:
Brought to you by Harmonic — The Complete Startup Database
Market maps finally work in venture software. Scout — the AI agent made for VCs allows you market map with ease. Simply describe what you’re looking for, or look up the competitive landscape for a particular company.
Scout handles the rest, scouring the internet as well as Harmonic’s private database trusted by thousands of investors from leading firms like GV and Insight.
SaaS CAC Payback Periods Hit Troubling Highs
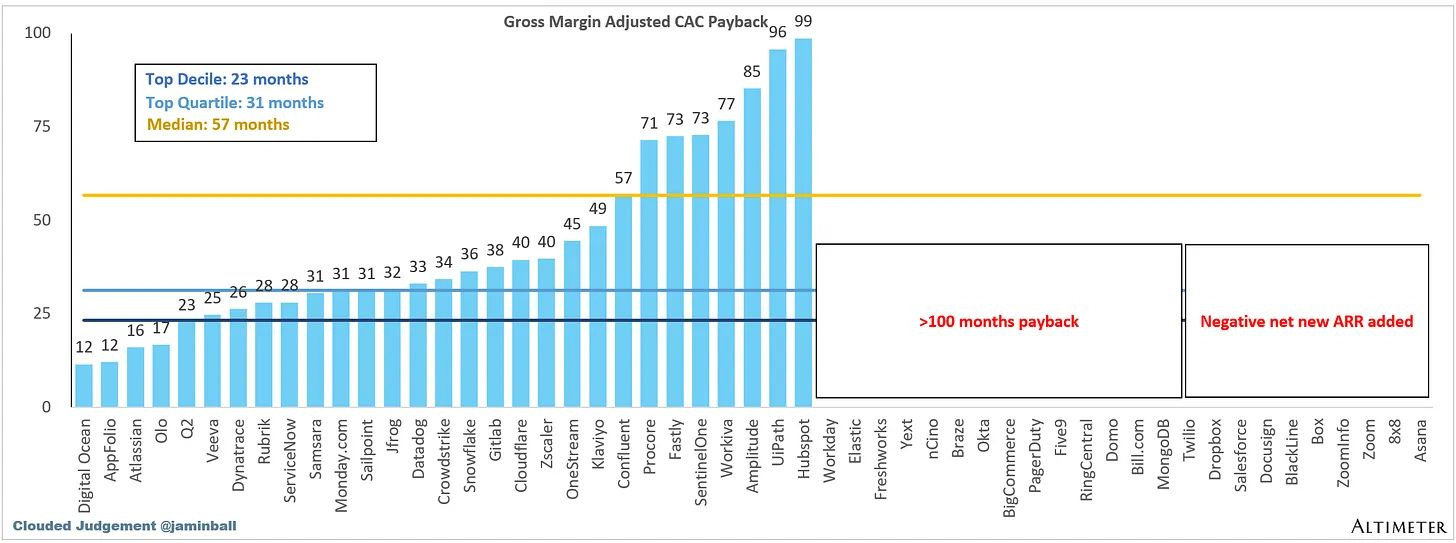
Kyle Poyar spotlights new data showing just how inefficient SaaS go-to-market teams have become. He shares numbers from Jamin Ball’s Clouded Judgement, indicating that sales and marketing costs now take years to recover, even for top performers.
Q1 2024 Average: Gross margin-adjusted CAC payback hit 57 months. That means even strong public SaaS companies need nearly five years to break even on new customer acquisition costs.
Best vs. Worst Performers: Zero public companies had CAC payback under 12 months. Only five were under 24 months, while 24 firms reported payback above 100 months or negative net-new ARR.
12-Quarter Trend: The average CAC payback over the past 12 quarters sits at 41 months, showing this is a persistent problem not explained away by one bad quarter or macro factors.
✈️ KEY TAKEAWAYS
Public SaaS companies face severe GTM inefficiency, with CAC payback periods stretching multiple years. This may force a reckoning as companies can’t rely on legacy customer subsidies forever.
Is AI Really Taking Startup Jobs?
Peter Walker examines 7 years of Carta hiring data to see if AI is replacing startup jobs. His analysis traces funding cycles, hiring booms, and how new AI-powered efficiency is reshaping headcount decisions.
Pandemic and ZIRP Boom: Hiring fell to ~20,000 per month during early COVID-19 fears, then surged in late 2020 and 2021 thanks to zero-interest-rate-fueled funding.
Funding Declines: Interest rates rose in early 2022, drying up VC money and pushing hiring down sharply. Even a funding uptick in 2024 didn’t restore previous hiring levels.
2025 Low Point: January 2025 marked the fewest Carta startup hires in 7 years as founders emphasized ARR per FTE and leaned on AI tools instead of expanding teams.
✈️ KEY TAKEAWAYS
Even as funding stabilizes somewhat, startups are hiring fewer equity-compensated employees than ever. AI-powered productivity gains and capital efficiency pressures are reshaping how founders think about team size.
How Big Should an Executive’s Target Bonus Be?
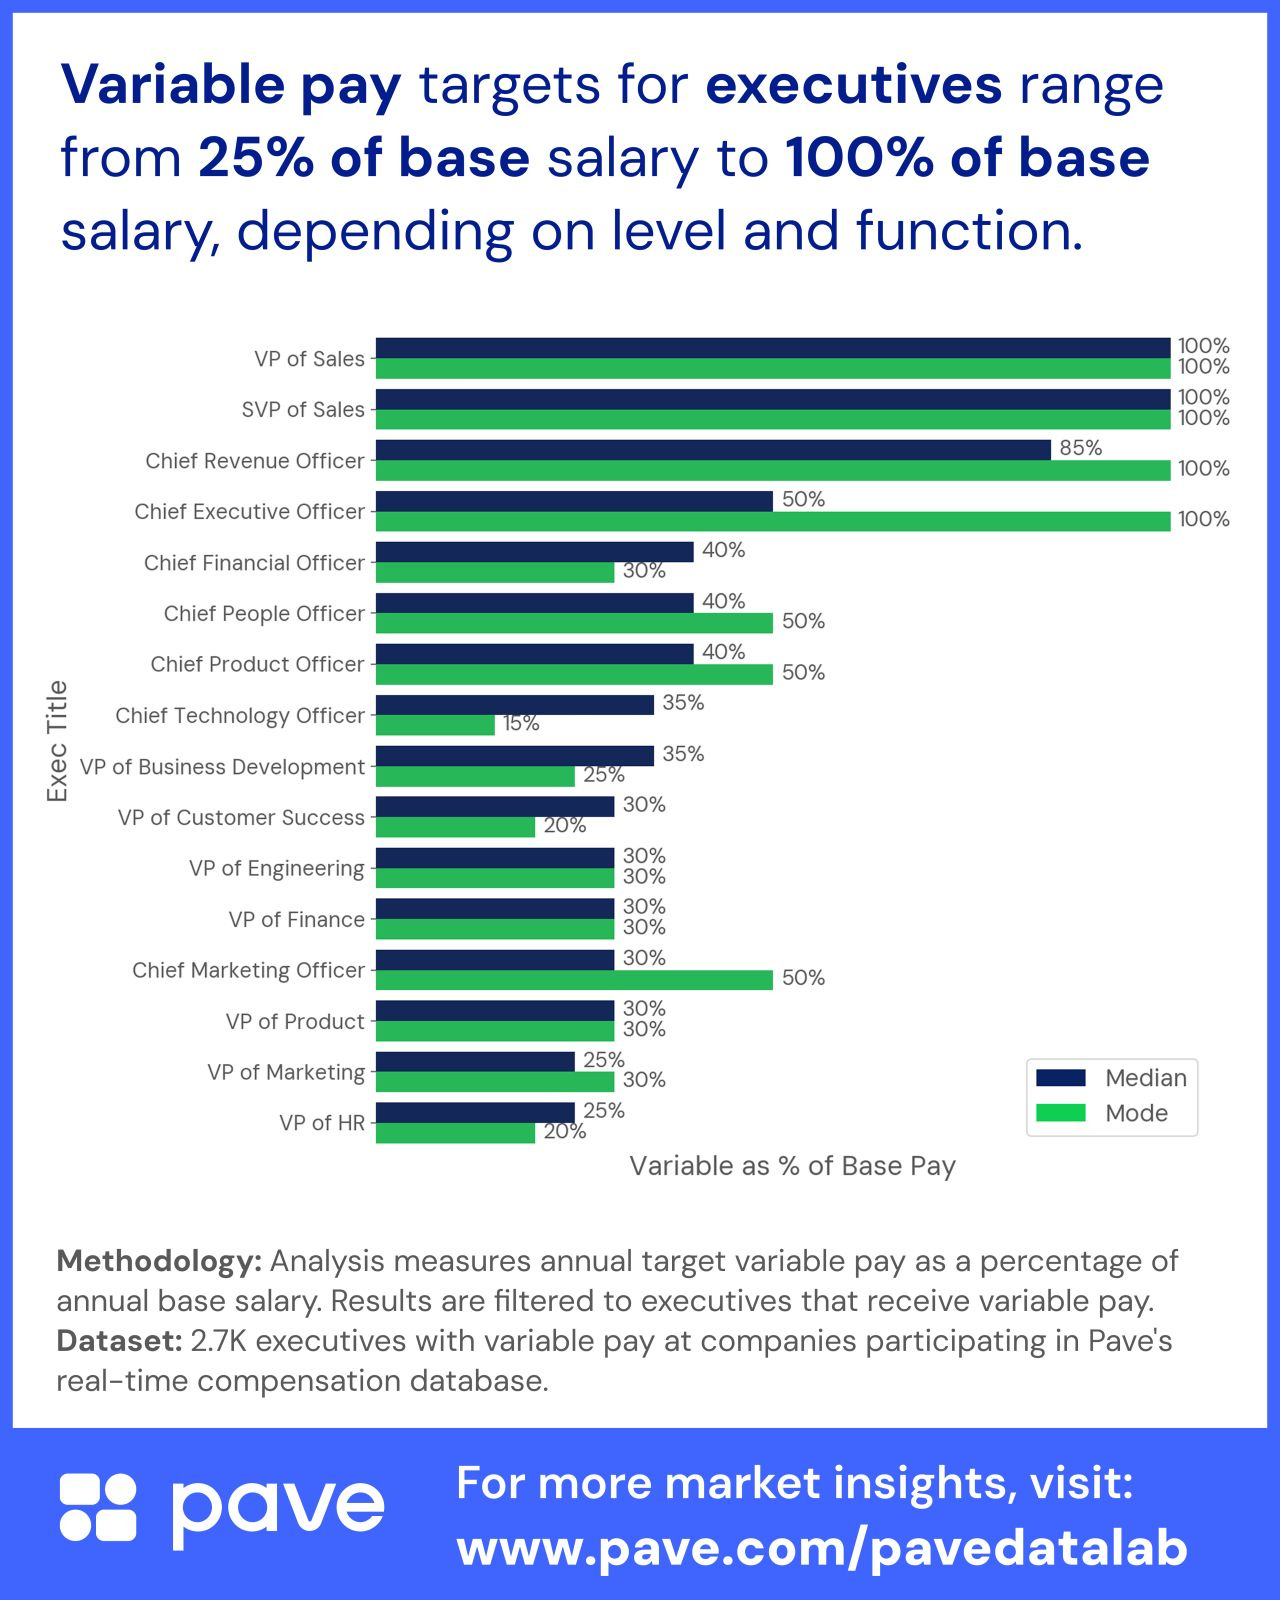
An analysis by Matt Schulamm breaks down target bonus percentages for over 2,700 executives with formal variable pay plans. The data highlights striking differences by role that can shape retention and alignment.
Sales Leadership Numbers: VPs and SVPs of Sales show both median and mode at 100%, with CROs at 85% median. These roles have the most aggressive bonus structures.
Tech and Product Roles: CTOs show a median bonus of 35% and a mode of 15%, while CPOs land higher at 40% median and 50% mode, reflecting different risk and incentive profiles.
The majority of Other Execs: Most other leadership roles cluster in the 20–30% median bonus range, including VPs of HR, Finance, Marketing, and Engineering.
✈️ KEY TAKEAWAYS
Bonus targets vary widely by role, with sales leaders typically on a 50/50 base-variable split. Compensation teams need to calibrate incentives carefully to balance risk, expectations, and retention.
New Benchmarks on AI Adoption for Finance Teams
Mostly Metrics shares fresh survey data on how finance teams are using AI by mid-2025. The report offers a snapshot of adoption levels, use cases, and organizational challenges faced by CFOs trying to scale AI.
Maturity by Company Size: AI adoption peaks in the $50M–$100M revenue range, with 30% reporting org-wide deployments, double the rate in SMBs and large enterprises.
Productivity Gains vs. Headcount Cuts: 70% of CFOs say AI improves team speed or output, but only 12% have reduced headcount, suggesting redeployment rather than replacement.
Scaling Challenges: Despite visible pilot successes in forecasting and closing, fewer than 1 in 5 finance teams have scaled AI throughout their organization.
✈️ KEY TAKEAWAYS
Finance teams see clear efficiency benefits from AI, but broad adoption remains uneven, with midsize firms leading the way while many struggle to measure ROI or deploy at scale.
When Should PLG Companies Add Sales?
Sofia Faustino’s analysis of 2,500 SaaS companies examines how B2B PLG strategies evolve with pricing, using website ‘Contact Sales’ forms as a proxy for hybrid go-to-market approaches. The data suggests clear pricing thresholds for adding sales.
Growth Below $100 ASP: Companies with <$25 ASP see 20% median new biz ARR growth using pure PLG, compared to 0% when layering in sales too early.
Hybrid Strategy Adoption: Most B2B PLG companies begin adding sales once ASP exceeds $100, signaling more complexity and a need for guided buying.
Notable Examples: Notion and Loom began as pure PLG but now use sales teams for enterprise plans, showing how GTM strategy matures with pricing.
✈️ KEY TAKEAWAYS
For PLG startups, timing sales integration is critical. Data shows early sales can slow growth at low price points, but become essential as ASP rises and customers demand more support.
US VC-Backed Startup Acquisitions Slow Down in H1 2025
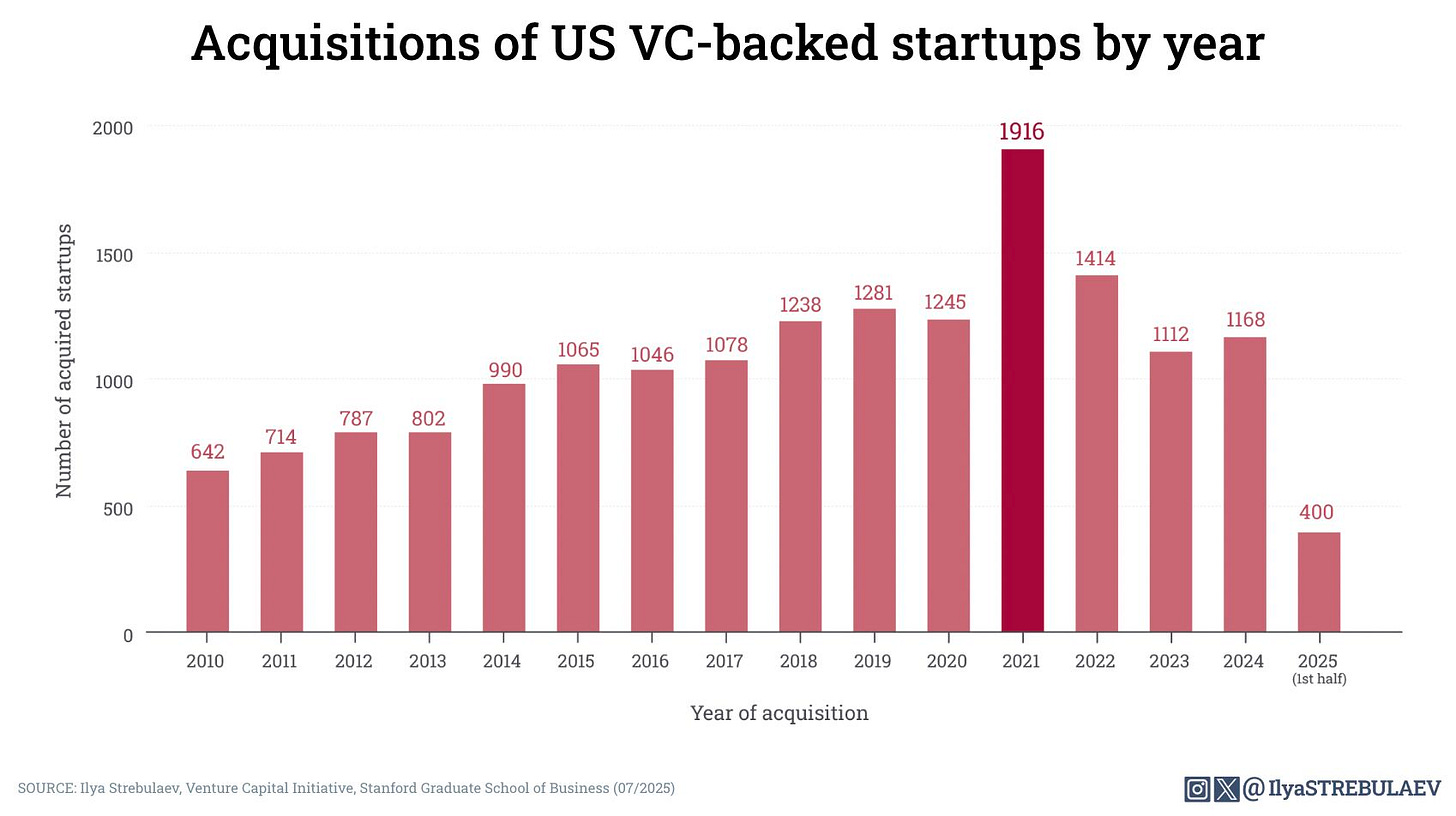
Ilya Strebulaev’s latest data tracks acquisitions of U.S. VC-backed startups over 15 years, revealing a steady rise through 2021, then a clear slowdown tied to shifting interest rates and deal financing costs.
Peak and Decline: Acquisitions grew from 642 in 2010 to 1,916 in 2021 before dropping to 1,168 in 2024, returning to 2016–2017 levels.
Yearly Breakdown: Recent totals were 1,414 in 2022, 1,112 in 2023, and 1,168 in 2024, reflecting the sustained impact of higher interest rates on deal volume.
2025 Half-Year Data: Just 400 acquisitions recorded so far in 2025, signaling a continued slowdown, though AI-focused deals remain a notable exception.
✈️ KEY TAKEAWAYS
After a 2021 surge fueled by low rates, U.S. startup acquisitions have slowed significantly. Rising financing costs and economic shifts are cooling overall M&A activity even as demand for AI capabilities persists.
Thanks to Jérôme Jaggi for his help with this post.
Stay driven,
Andre
Thank you for reading this episode. If you enjoyed it, leave a like or comment, and share it with your friends. If you don’t like it, you can always update your preferences to reduce the frequency and focus on your preferred DDVC formats. Join our community below and follow me on LinkedIn or Twitter to never miss data-driven VC updates again.


