👋 Hi, I’m Andre and welcome to my newsletter Data Driven VC which is all about becoming a better investor with Data & AI. ICYMI, check out some of our most read episodes:
Welcome to another edition of our Sunday “Resources” stream where we share our most valuable data & resources across four rotating formats:
30 Hottest Startups of the Month (September’s list here)
Top Downloaded Resources from The Lab #1 (How to prompt - the definitive guide for investors, founders & operators here)
State of the Market (this is today!)
Top Downloaded Resources from The Lab #1 (see “how to turn Google Sheets into your competitor radar” here)
For 1. and 3., we collaborate with best-in-class partners to ensure you get the highest quality data.
For 2. and 4., we leverage our ever-growing product portfolio and share selective snapshots of the most sought-after resources from VCSTACK.COM
State of the Market - September 2025

Most data for today’s episode was provided by our partner Multiples.vc, your go-to source for verified M&A valuation multiples and public comps based on analyst estimates, at a fraction of the price of legacy data providers.
With this monthly format, we aim to unify market & valuation data into a single episode, so you don’t need to check various sources for a complete picture. Here’s what we’ll cover today:
#1 Markets
Top 10 private market companies + Antrophic, Databricks, Revolut
State of IPOs: Top 50 candidates + Klarna
State of M&A: Number of transactions, deal volume + Sana & Workday
#2 Multiples
Top 10 vs Top 50 EV/NTM Revenue
EV/NTM Revenue over time and by sector
Efficiency Benchmarks incl. revenue per FTE, Rule of 40 & more
Spoiler: The “best-in-class” cohort is gradually shifting from hypergrowth toward more sustainable, though slightly slower, expansion.
We have a lot on the agenda, so let’s jump in👇
1. Markets
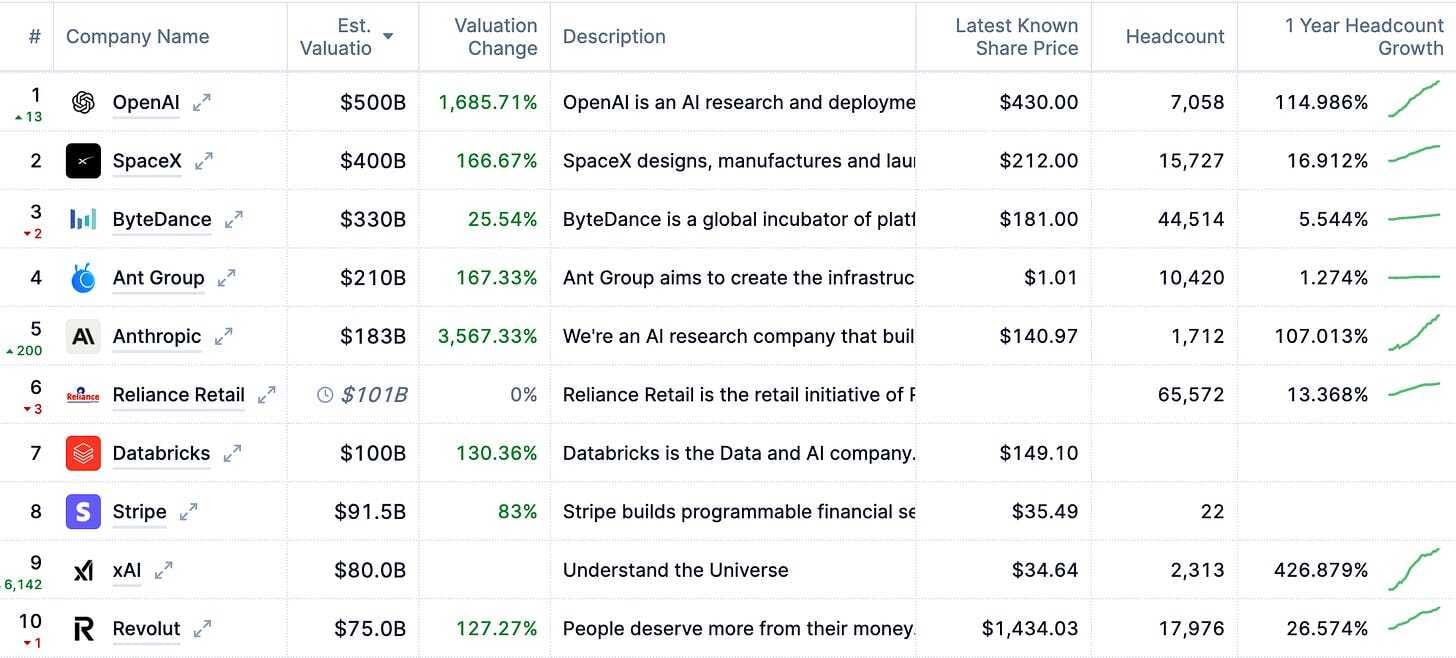
Top 10 Private Market Companies

Source: Position.so
Lots of movement in the top 10 most valuable private market companies within the last month. Antrophic announced their $13bn Series F raise on $183bn valuation, moving to spot #5. Databricks raises at $100bn valuation, up from $62bn and jumping to #7. Revolut is in the process of a secondary tender offer for their employees and early shareholders, increasing its valuation to $75bn.
These datapoints strengthen the trend of companies staying private for longer and allowing private market investors capture an increasing chunk of the value created by the fastest growing companies. Good times for the asset class.
Top 50 IPO Candidates

Talking about the private market asset class, one bottleneck remains liquidity. So let’s look at the first of two channels: IPOs.
Subsequent to the Figma filing on July 1st, we just saw Klarna complete their IPO on September 10th, raising about $1.37 billion at roughly $15 billion valuation. That’s a significant drop from its earlier $45 billion private peak. Shares opened strong at $52 and closed the first day at $45.82, about 15% above IPO price.
3/4 into the year, we have about 80% of our 2025 IPO candidate list left. Many of whom are cueing up and hoping for the window to widen and remain open.
State of M&A
At least as interesting as public markets these days is M&A activity, the second path for liquidity in the private market asset class.
Despite the summer break, we’ve seen continuous M&A activity. In the chart above, we only include M&A transactions with confirmed EVs available at Multiples.vc, thus structurally exclude the long tail noise of smaller EV transactions.
While we’re at 62% in number of transactions relative to the FY2024 (2294 deals YTD vs 3708 deals in FY 2024), the deal volume is at 84% - a clear indication towards fewer but significantly bigger transactions as confirmed by a 40% increase in deal size YoY.
Looking at the largest transactions of the last 30 days, we see the acquisition of EchoStar by SpaceX for $17bn, among others. The median deal size was $153m with a 1.6x EV/revenue multiple.
In terms of highest EV/Revenue transaction, Swedish scale-up Sana leads the way with their sale to Workday at $ 1.1bn and an implied multiple of 110x. That’s about fifteen times as high as the top 10 median multiples of 7.3x.
Subscribe to DDVC to read the rest.
Join the Data Driven VC community to get access to this post and other exclusive subscriber-only content.
Join the CommunityA subscription gets you:
- 1 paid weekly newsletter
- Access our archive of 300+ articles
- Annual ticket for the virtual DDVC Summit
- Discounts to productivity tools
- Database Benchmarking Report
- Virtual & physical meetups
- Masterclasses & videos
- Access to AI Copilots


