
👋 Hi, I’m Andre and welcome to my newsletter Data-Driven VC which is all about becoming a better investor with Data & AI. Join 33,980 thought leaders from VCs like a16z, Accel, Index, Sequoia, and more to understand how startup investing becomes more data-driven, why it matters, and what it means for you.
Welcome to another edition of our Sunday “Resources” stream where we share our most valuable data & resources across four rotating formats:
For 1. and 3., we collaborate with best-in-class partners to ensure you get the highest quality data. For 2. and 4., we leverage our ever-growing product portfolio and share selective snapshots of the most sought-after resources from The Lab.
Get unlimited access to everything including all (250+ old and new) newsletter episodes, AI agents, automation templates, tickets for our virtual summits and roundtables, recordings from all our events, video deep dives, podcasts, reports, and a lot more here via The Lab

State of the Market - May 2025
Most data for today’s episode was provided by our partner Multiples.vc, your go-to source for verified M&A valuation multiples and public comps based on analyst estimates, at a fraction of the price of legacy data providers.
We aim to unify all macro, market & valuation data into a single episode, so you don’t need to check various sources to get a complete picture. Here’s what we’ll cover today:
#1 Macro:
Key events: rate cuts, tariffs, USD sell-off & more
Key indicators: Fear & Greed, Bull & Bear
Key quotes: JP Morgan, Apollo, Bridgewater & more
#2 Markets
Top 10 private market companies + spotlight OpenAI
State of IPOs: Top 50 candidates & sentiment
State of M&A: Number of transactions, deal volume, top deals & more
#3 Multiples
Top 10 vs Top 50 EV/NTM Revenue
EV/NTM Revenue over time and by sector
Efficiency Benchmarks incl. revenue per FTE, Rule of 40 & more
We have a lot on the agenda, so let’s jump in👇
1. Macro
Over the past 30 days, global markets have navigated a complex and shifting economic landscape shaped by evolving macroeconomic signals, central bank policies, and geopolitical undercurrents.
In April 2025, the ECB reduced its key interest rates by 25 basis points, bringing the deposit facility rate to 2.25%, in response to easing inflation pressures. However, with concerns about future inflationary pressures due to rising government spending and trade barriers, the ECB is considering a pause in rate cuts after June.
In the US, persistent core inflation driven by robust consumer demand and a tight labor market has led to elevated bond yields, signaling market expectations of slower growth and sustained inflation. Moody's downgraded the US credit rating from Aaa to Aa1, citing rising federal debt and persistent fiscal deficits, leading to a sell-off in government bonds and a drop in the US dollar.
Geopolitical tensions, including trade conflicts and ongoing conflicts in the Middle East and Eastern Europe, continue to impact global economic stability, with the IMF warning that such events can significantly affect countries with close economic and financial links to conflict-afflicted regions.
The Fear & Greed Index below showcases how these dynamics translate into investor sentiment.
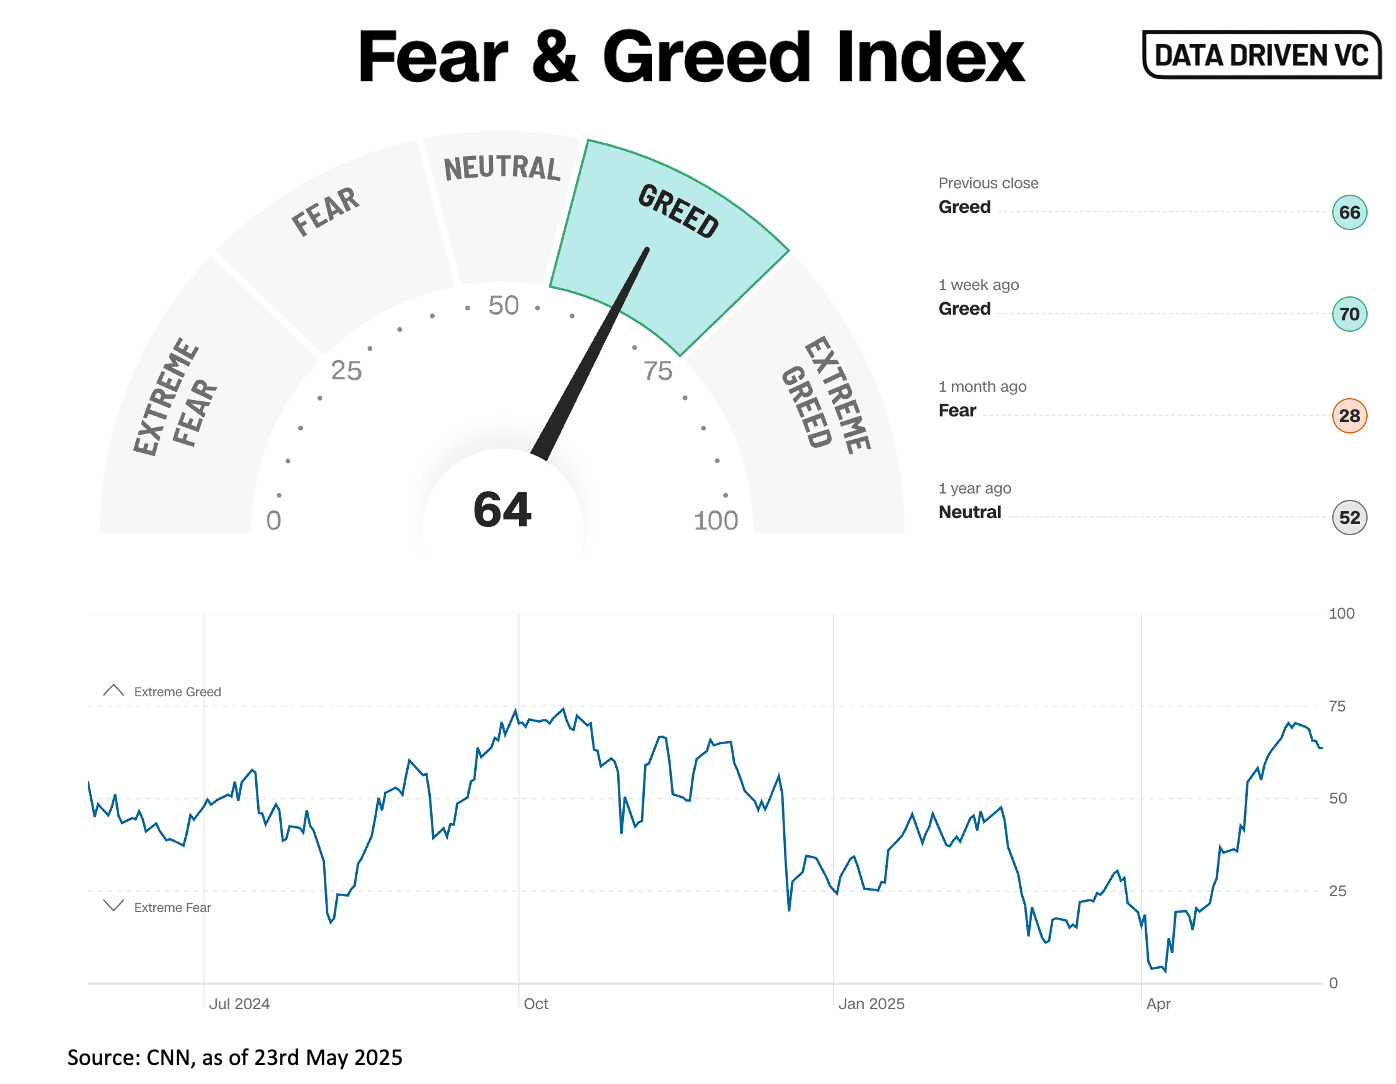
On a scale of 0 = extreme fear to 100 = extreme greed, we’re currently at a 64 with a strong upward trend, coming from just 35 last month.
The Fear & Greed Index has painted a clear picture of shifting investor psychology, oscillating between caution and opportunism in response to mixed macro signals. Early in the month, the index hovered in “Fear” territory, driven by rising bond yields, persistent inflation concerns—particularly in the U.S.—and Moody’s downgrade of the U.S. credit rating. These developments fueled anxiety over stagflation risks and fiscal instability, leading to a flight to safety and increased volatility in equity markets.
However, mid-month saw a moderate rebound toward “Neutral” or mild “Greed”, especially after the European Central Bank’s decision to cut interest rates—a move interpreted as the beginning of a policy pivot in Europe. Lower inflation prints in select regions and signs of economic resilience also calmed nerves, prompting a tentative return to risk assets.
Yet, persistent geopolitical tensions and skepticism about the sustainability of rate cuts tempered any prolonged surge in optimism. By the end of the month, the index reflected a cautious equilibrium, suggesting investors remain highly sensitive to macro developments and are balancing hope for monetary easing with underlying fears of economic and political instability.
Let’s complement this view with the GS Bull/Bear Market Indicator.
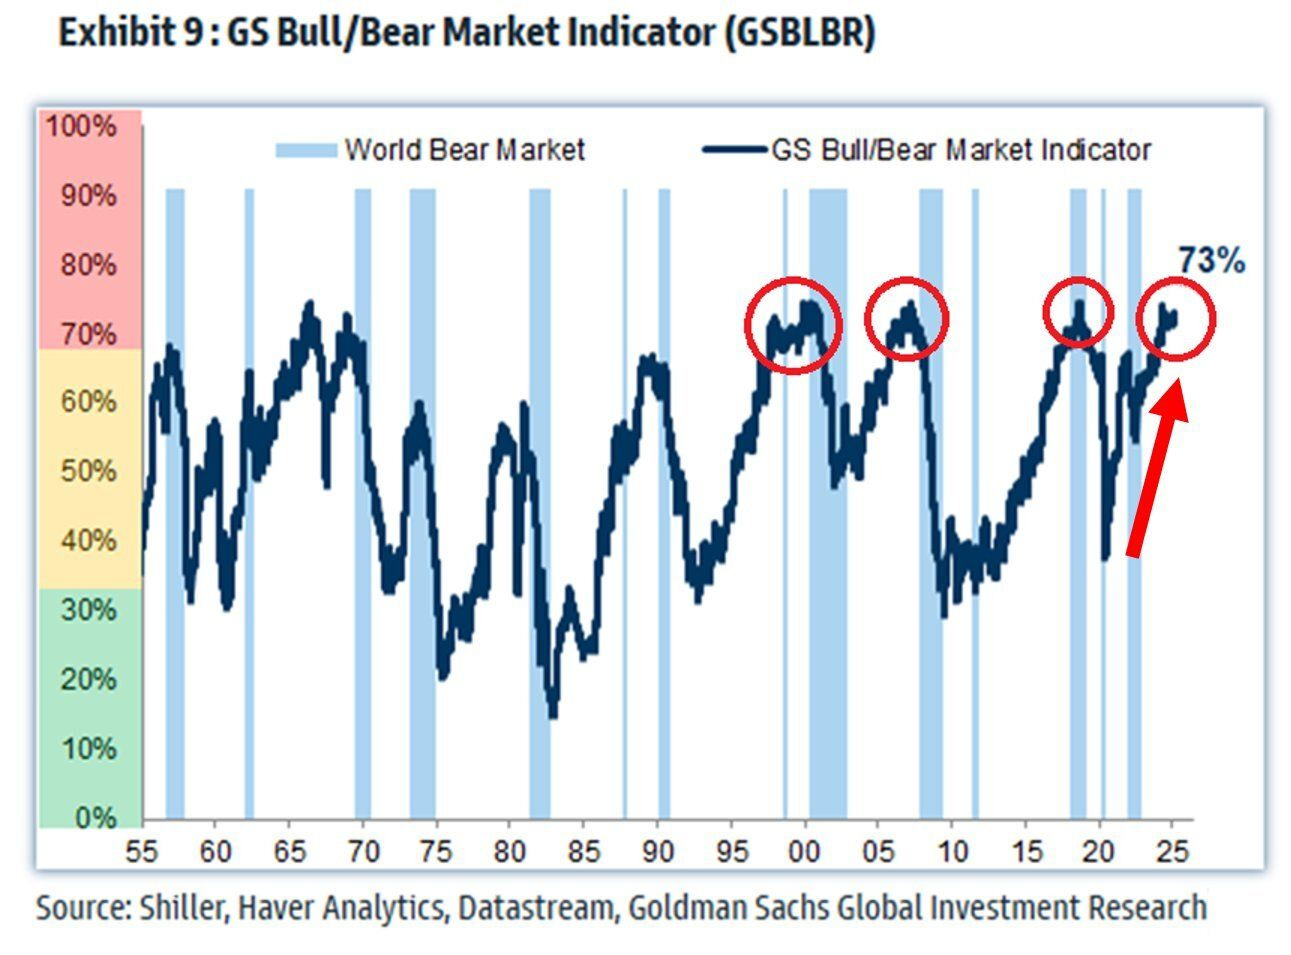
On a scale of 0% = bullish to 100% bearish, the GSBLBR Indicator has climbed to 73%, a further 3% increase compared to last month, putting it at a historically high level that often signals caution for investors.
This composite measure—driven by historically high equity valuations (in the 95th percentile), a deeply inverted yield curve, and ultra-low unemployment—suggests that underlying macroeconomic imbalances may be brewing beneath the surface.
While the indicator has a solid track record of anticipating bear markets, it’s also known for issuing early warnings, meaning elevated levels can persist before any downturn materializes. Nonetheless, the current reading reflects growing fragility in the market’s foundations and warrants a cautious, risk-aware approach.
With these two quantitative measures at hand, let’s look at more qualitative indicators in form of quotes from economic, finance, and political leaders throughout the last 30 days.
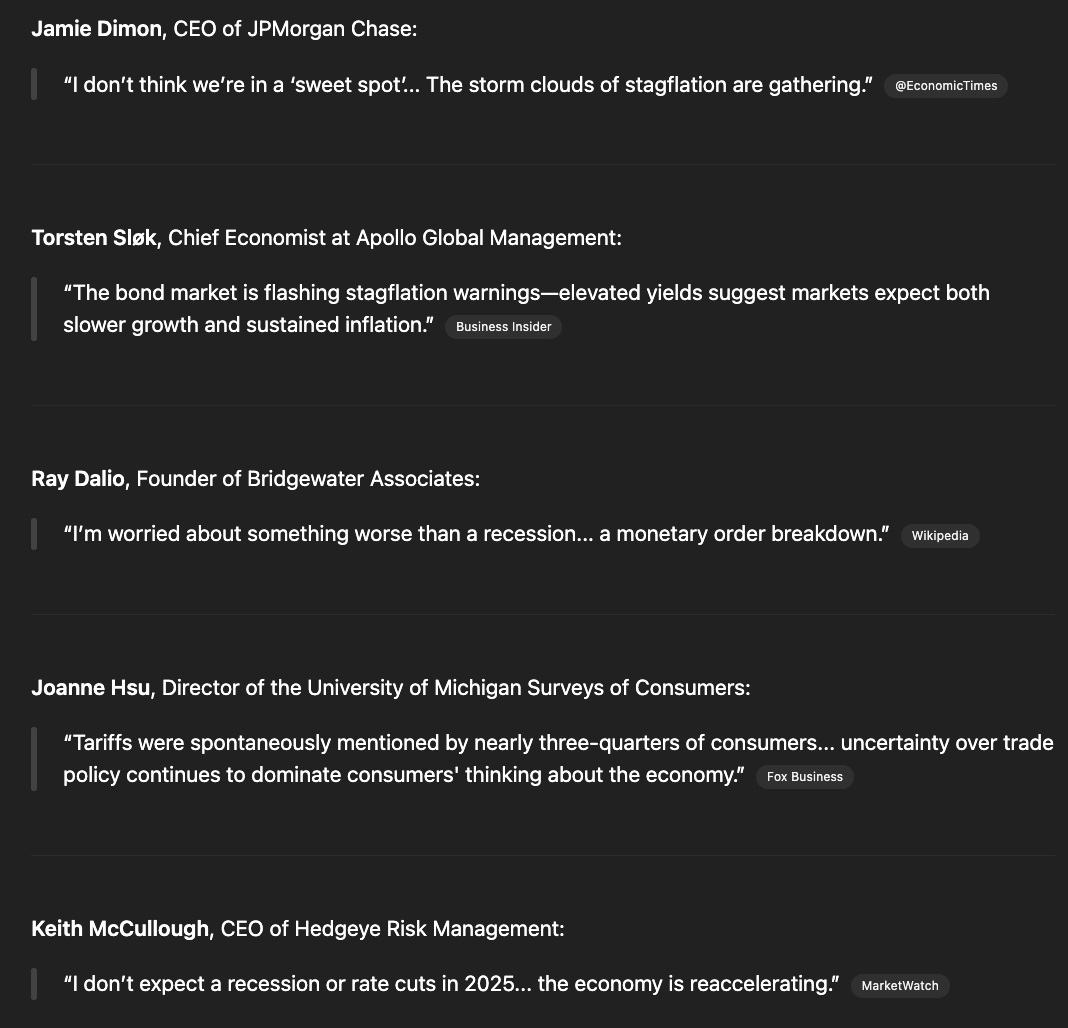
In summary, quantitative indicators and qualitative perspectives are aligned with worries and uncertainty, yet with a moderate rebound and an early “economic reacceleration”.
2. Markets
Let’s start with some insights about one of private market’s darlings and second highest valued private market company in the world: OpenAI.

Data Source: Position.so
The team around Sam Altman continues to deliver one surprise after another. Here’s a few highlights from last month:
300B valuation, bringing the total raised to $62.5B, yet decided to remain non-profit after long back and forth
Tripled headcount YoY to surpass 6k FTE and hired key leaders such as Fidji Simo from Instacard as Head of Applications, potentially an indication that free user monetization might come sooner than later
Acquired Jony Ive's AI hardware startup, io, for $6.5 billion last week in an attempt to launch the most disruptive hardware device that you would carry in addition to your phone and laptop
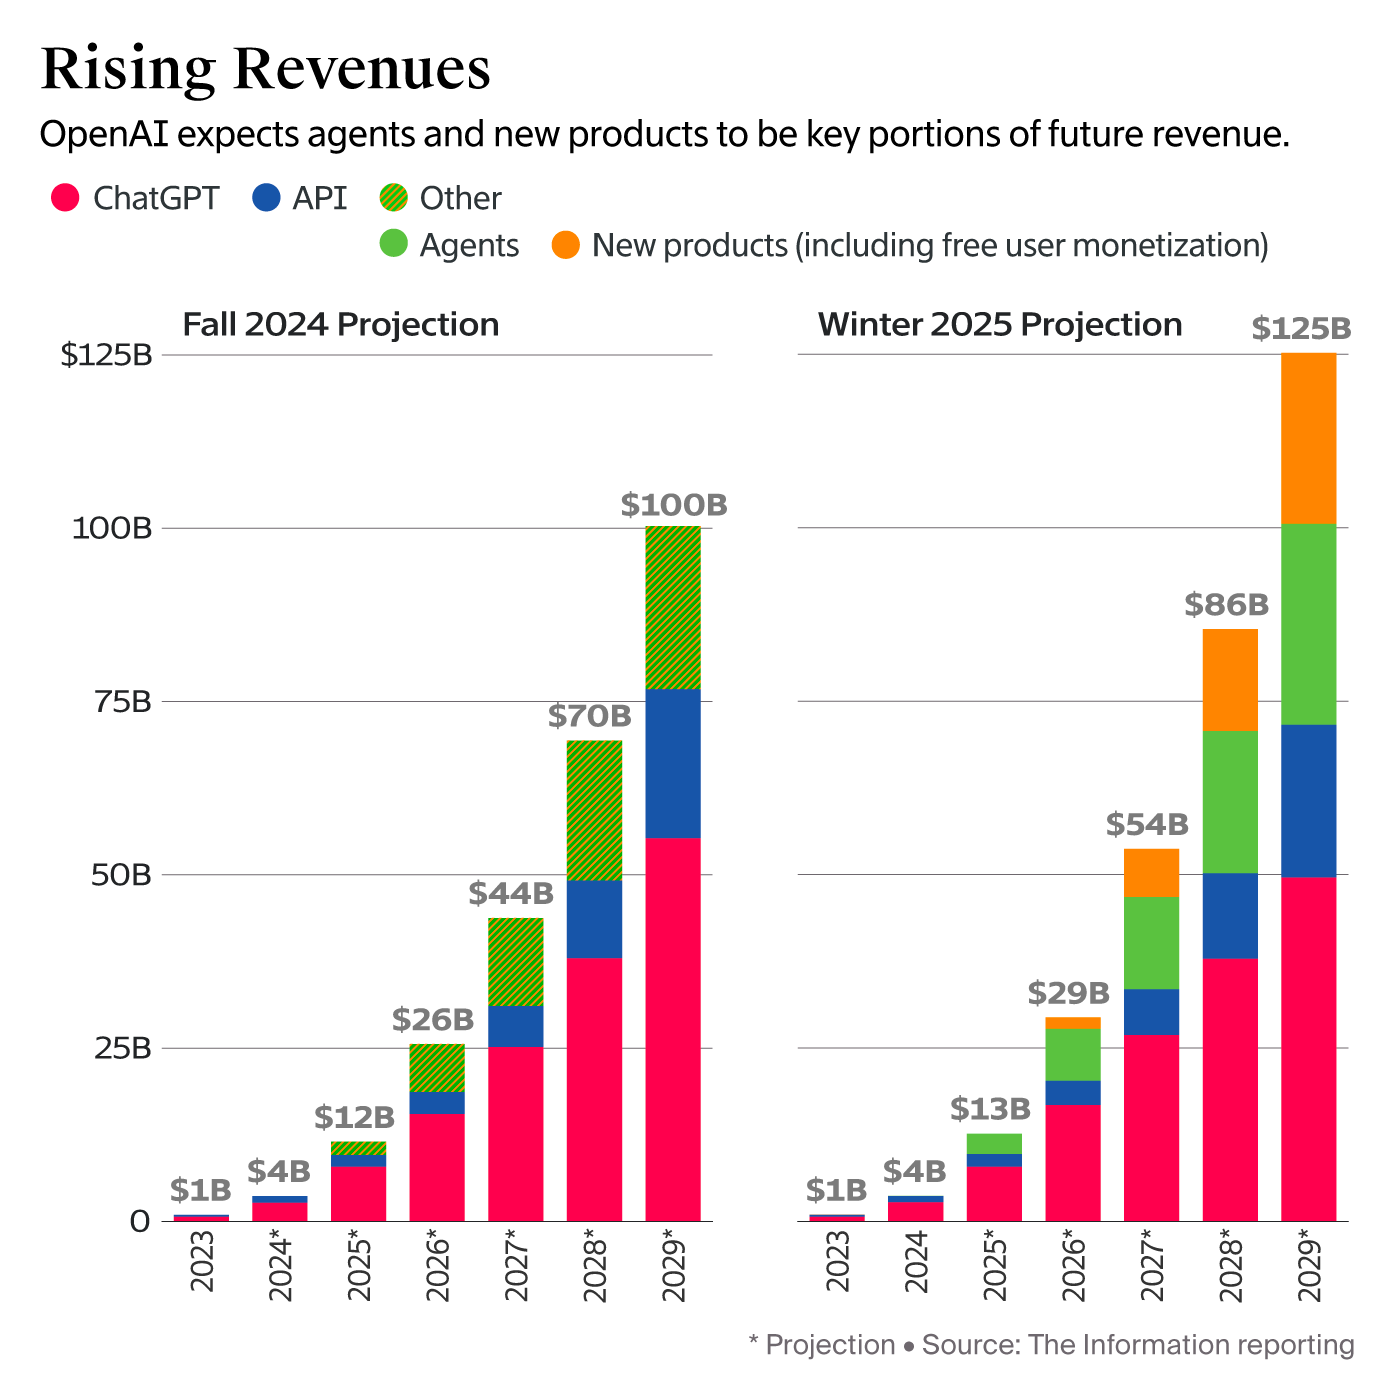
I’m sure there’s more to come on their way of hitting $100B in revenue in the next 4y. Growing at light speed, even at these absolute levels, might make them consider hitting the public markets sooner or later too.
This being said, let’s look at the top 50 IPO candidates for 2025 & 2026.
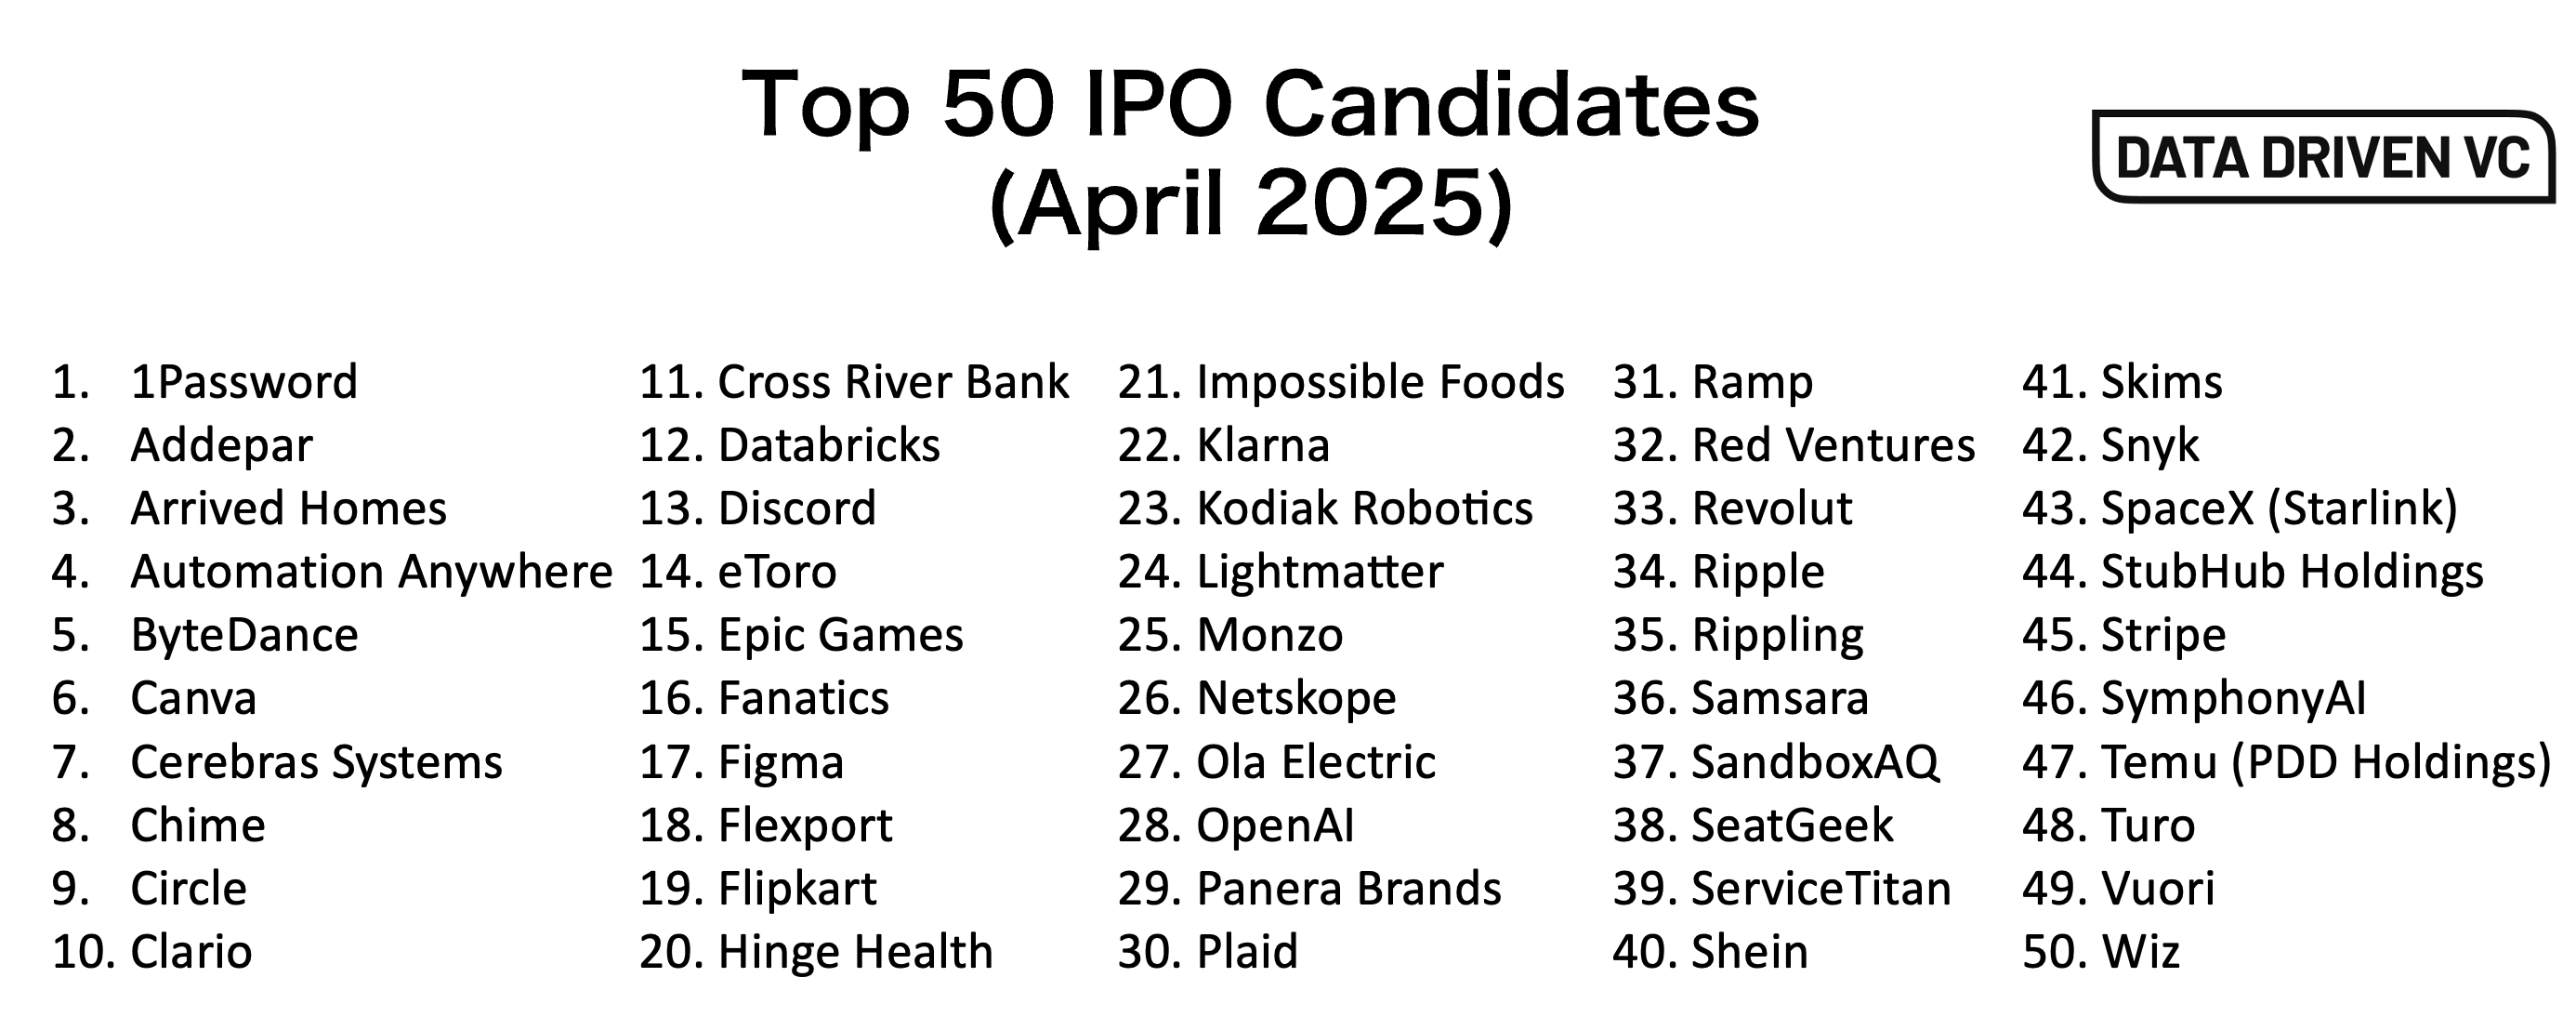
In our last market update, we described how majority of IPO candidates pushed back their plans due to macro uncertainty and tariff news. In line with the shift from fear to greed in the last 30 days, we see the IPO window cautiously reopening.
"The strong aftermarket performance of these and other recent tech IPOs, like CoreWeave, ServiceTitan, Rubrik, and Reddit, indicate investor appetite for tech IPOs, especially for companies with solid financials and growth prospects," said Greg Martin, managing director at Rainmaker Securities
Improved sentiment—fueled by cooling inflation in Europe, signals of rate cuts from the ECB, and ongoing enthusiasm around AI—has prompted investor interest to slowly return, especially for firms with clear revenue growth and improving profitability metrics.
One of the first to hit the market after the big uncertainty was Etoro and with a close at 29% above its IPO price, it serves as a big boost for other companies to follow path. Cuing in line, we see Klarna, Dischord, Hinge Health, Figma, and Chime, among others, preparing their IPOs and driving hope for liquidity in the venture ecosystem.
Talking about liquidity, let’s close this section with a quick look at M&A activity.

Data Source: Multiples. vc
We only include M&A transactions with confirmed EVs available at Multiples.vc, thus structurally exclude the long tail noise of smaller EV transactions. With 1186 disclosed transactions YTD, we’re still behind the same period in 2024, continuing to be the lowest in over a decade. While we’re at 32% in number of transactions relative to the FY2024, the deal volume is at $1.1T and 42% relative to FY2024 - a clear indication towards fewer but significantly bigger transactions as confirmed by the increase in average deal size close to $1B.

Data Source: Multiples.vc
A comparison of the largest M&A deals above with the highest valued M&A deals based on EV/NTM Revenue multiples below shows that the bigger the transaction, the lower the multiple.

In summary, we see a potential re-opening of IPO windows and modest M&A activity. Yet, both is only relevant for best-in-class assets.
3. Multiples
Compared to last month, multiples are up.
Let’s start with a snapshot of top companies based on EV / NTM Revenue multiples. For all analysis below, we exclude companies with market caps below $1B and non-meaningful multiples above 100x.

Data Source: Multiples.vc
Top 10 average and median grew month-over-month from 21.1x to 24.2x and from 19.0x to 20.1x, respectively. Palantir continues to lead the pack with a 65x EV / NTM revenue multiple, likely due to a combination of 32% growth and 80% gross margin.

Data Source: Multiples.vc
Historic trend line of top 10 median and overall median shows a widening gap, supporting that outliers receive a relatively higher premium than the overall market. An indication that more capital is concentrated in top companies.

Data Source: Multiples.vc
While top 10 average is at 24.2x, the top 50 average is only at 13.7x EV / NTM revenue, indicating that the bar is very high and the gap between the leaders and the rest already starts somewhere in the top 20. Below table shows the average and median EV / NTM revenue multiples by sector.
Subscribe to our premium content to read the rest.
Become a paying subscriber to get access to this post and other resources from the exclusive Data Driven VC community.
UpgradeA subscription gets you:
- Lists of 312 Family Offices + 59 Pension funds + 1513 angels
- Annual ticket for the virtual DDVC Summit
- Access our archive of 300+ articles
- 1 new premium article per week
- Virtual & physical meetups
- Masterclasses & videos
- Access to AI Copilots
- Prompt Database
- ... and lots more