👋 Hi, I’m Andre and welcome to my newsletter Data-Driven VC which is all about becoming a better investor with Data & AI. Join 30,850 thought leaders from VCs like a16z, Accel, Index, Sequoia, and more to understand how startup investing becomes more data-driven, why it matters, and what it means for you.
Brought to you by Affinity — Deal Sourcing Strategies for 2025
At a time when 42% of VCs cite increased competition as a key challenge, how do you ensure your firm stays ahead? Sourcing the highest quality deals as early as possible is key. Affinity's new deal sourcing guide offers practical insights from industry leaders at Kleiner Perkins, Intel Capital, and more.
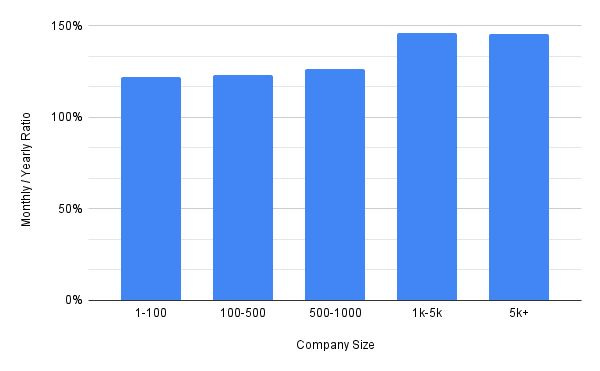
Pricing SaaS: Monthly versus Yearly Rates
Guy Barner analyzed 50 SaaS pricing pages to reveal how companies structure their monthly versus yearly subscriptions. The median ratio? 125%, translating to a 20% discount for annual payments (or 2.4 free months).
The “Four Free Months” Club: About 10% of companies push to a 150% ratio, offering an aggressive discount with four months effectively free for annual subscribers.
Big Players, Bigger Optimizations: Larger SaaS companies tend to emphasize higher monthly fees while fine-tuning annual discounts, showing more deliberate strategies than smaller counterparts.
Pricing Presentation Chaos: Examples range from Dash.app’s default display of higher monthly costs to Wix’s unclear annual options. QuickBooks’ labyrinthine structure? Perfect for accountants.
✈️ KEY TAKEAWAYS
SaaS pricing ratios reveal a balance between incentivizing annual payments and not undervaluing monthly fees. Companies with simpler, transparent pricing may gain trust over convoluted models.
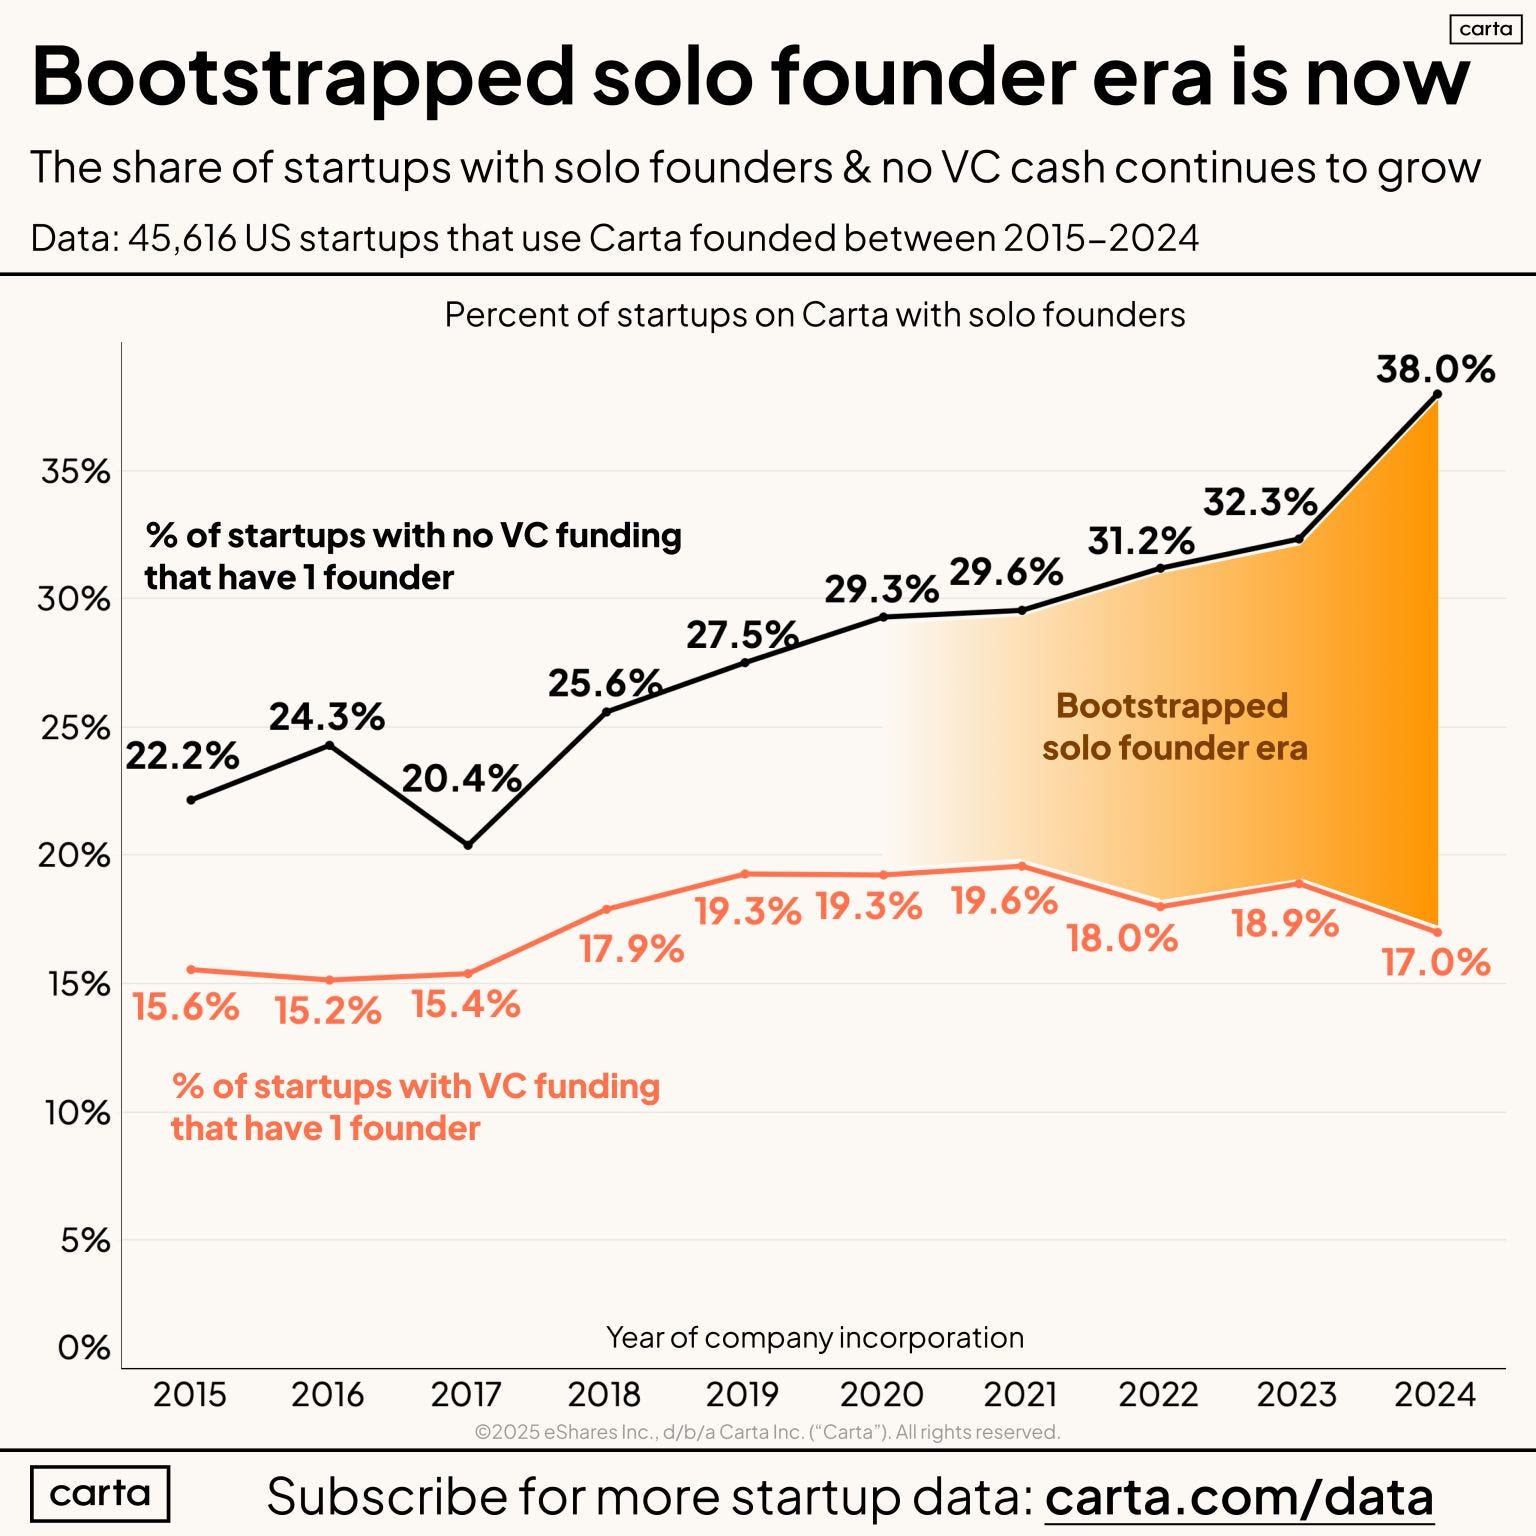
The Rise of the (Bootstrapped) Solo Founder
Sam Altman envisions a future where a single-person company achieves a $1 billion valuation. While we’re not there yet, the solo founder trend is undeniable. According to data from Peter Walker, in 2017 17% of startups had a solo founder. By 2024, that figure jumped to 36%.
Flatlined Funding: Despite the surge in solo-founded startups, only 16%-19% of VC-backed companies have a single founder—a figure that has barely budged over the years.
Bootstrap Revolution: Many solo founders skip the VC route entirely, favoring bootstrapping and alternative funding models over traditional investment.
AI as a Catalyst: With AI tools lowering startup barriers, the micro-startup era might be approaching, where individuals leverage tech to run lean, scalable companies.
✈️ KEY TAKEAWAYS
While solo founders are more common than ever, VC preferences lean toward teams. The future of startups may favor individual founders as AI and tech reduce the need for large teams and external funding.
Will Unicorn Exits Ever Get Back to 2021 Levels?
According to Ilya Strebulaev’s latest post, the unicorn exit market peaked in 2021, when 189 companies delivered a staggering $764 billion in total exit value, more than double the record set in 2020. But the golden year appears to be an outlier rather than a trend.
2021 by the Numbers: An unprecedented $4B average exit valuation and a cumulative $1.3T exit value during the 2019–2021 boom marked the pinnacle of unicorn exits.
Stabilizing Exits: Since 2021, average valuations have tempered—2022 saw $1.5B (32 exits), while 2023 rose to $2.6B (18 exits). Current 2024 data suggests further moderation with a $2.1B average (19 exits).
Historical Context: Across 40+ years, 738 unicorns have exited, averaging $3.2B per exit, with 2019’s $5.4B yearly average exit value remaining a standout.
✈️ KEY TAKEAWAYS
While unicorn exits have cooled since 2021, their historical significance and the sheer scale of the 2019–2021 period remain benchmarks for future markets.
2024 SaaS Benchmarks Report
High Alpha’s 2024 SaaS Benchmarks Report, in collaboration with OpenView, offers a comprehensive analysis of the SaaS landscape, highlighting trends in AI integration, market stabilization, and growth strategies.
Generation AI Emergence: The proliferation of generative AI is reshaping SaaS companies, with nearly 70% incorporating AI components into their offerings. AI-native and vertical SaaS firms are outperforming horizontal counterparts, signaling a shift towards specialized, intelligent solutions.
Market Stabilization Observed: After two years of declining growth and retention rates, the market is showing signs of stabilization. Public SaaS companies report steady net dollar retention at 110%, with revenue growth stabilizing between 17%-18%. Venture capital investment is also rebounding, with nearly a third of 2024 investments directed towards AI-native companies.
Balancing Growth and Efficiency: Successful SaaS companies are achieving both growth and efficiency, leading to gains in employee productivity. Early-stage companies, particularly those under $5M ARR, have increased efficiency more than their larger counterparts, indicating a trend towards leaner operations.
✈️ KEY TAKEAWAYS
The SaaS industry is undergoing significant transformation, driven by AI integration and a focus on efficient growth. Companies that adapt to these trends are well-positioned for success in the evolving market landscape.

Share this article with others who might benefit.
Is Your Org Chart Too Flat or Too Hierarchical?
The question of whether flatter org charts are faster depends on context. Pave’s team analyzed 7,558 companies to benchmark management layers from CEOs to individual contributors (ICs) across different company sizes.
Org Chart Benchmarks: At 1-50 employees, companies average 4 layers (median), while larger organizations (3,001+ employees) average 10 layers. The progression shows a clear trend of increasing hierarchy as companies scale.
Span of Control Matters: Companies with fewer layers often have broader spans of control, while those with more layers risk becoming top-heavy. These are correlated but not causal, suggesting companies should assess their structures holistically.
Tight Distributions: Benchmarks showed consistent patterns, with minimal variation within each size category, suggesting predictable org chart growth as headcounts increase.
✈️ KEY TAKEAWAYS
Org chart depth correlates with company size. Whether flat or hierarchical, businesses should balance spans of control and consider blind spots in their structure to optimize decision-making and efficiency.
4 Ways to *Really* Differentiate
In a crowded market, finding your product’s edge is no easy feat. Kyle Poyar at Growth Unhinged, provides a structured product positioning framework with a clear roadmap to stand out by focusing on what matters most to your customers:
Identify the Competition: Define the alternative customers would use if your product didn’t exist—be it outdated processes or competitors’ offerings.
Highlight the Problem: Emphasize the inefficiencies or gaps in those alternatives to set the stage for your solution.
Show Why You’re Better: Communicate how your product uniquely solves the problem and delivers superior outcomes.
✈️ KEY TAKEAWAYS
Differentiation requires pinpointing your competition, showcasing its weaknesses, and positioning your product as the clear superior solution.
Thanks to Jérôme Jaggi for his help with this post.
Stay driven,
Andre
Thank you for reading this episode. If you enjoyed it, leave a like or comment, and share it with your friends. If you don’t like it, you can always update your preferences to reduce the frequency and focus on your preferred DDVC formats. Join our community below and follow me on LinkedIn or Twitter to never miss data-driven VC updates again.
What do you think about my weekly Newsletter? Love it | It's great | Good | Okay-ish | Stop it


